
Superheat and Subcooling: The HVAC Technician’s Field Guide

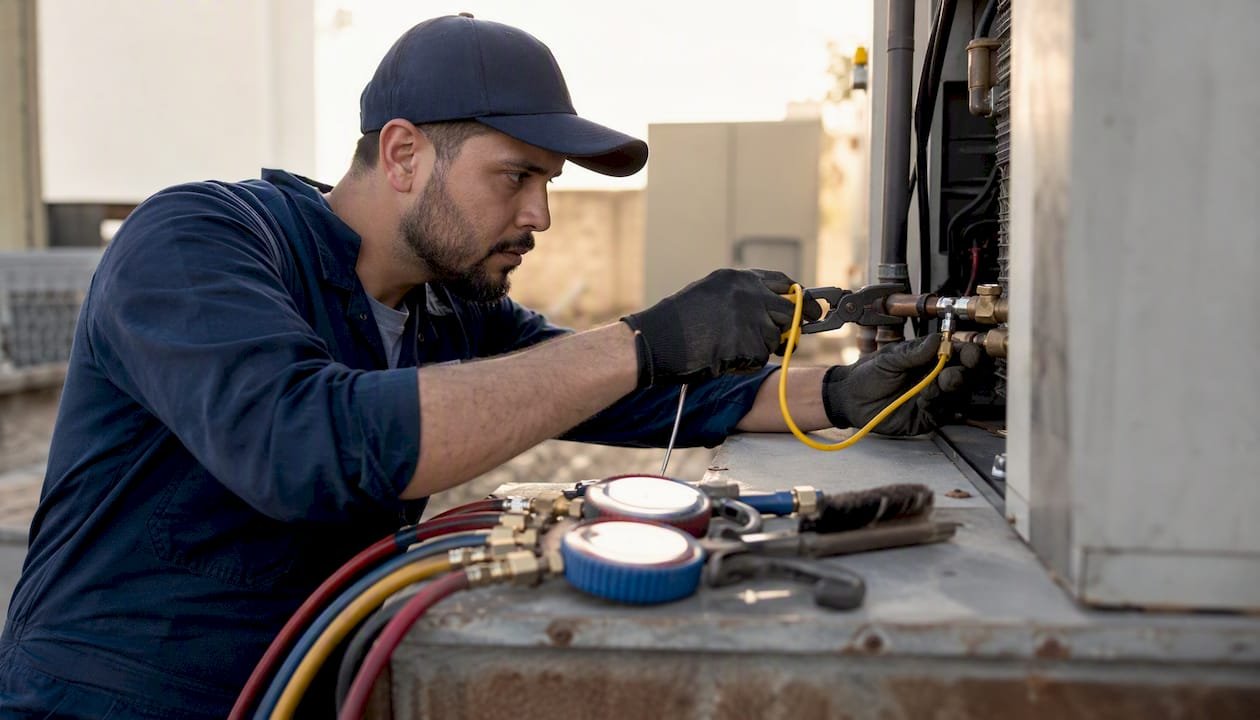
Superheat and subcooling are the two diagnostic numbers that tell you whether a refrigerant charge is correct and whether the compressor is safe. Superheat measures how many degrees above its boiling point the refrigerant vapor is at the suction line. Subcooling measures how many degrees below its condensing point the liquid refrigerant has dropped at the liquid line. Get both right, and you know the system is charged properly. Get either wrong, and you’re guessing.
Here’s the quick-reference version before you dig in:
- Fixed-orifice (piston) systems: charge by superheat. Target range is typically 10–20°F, though the exact value depends on indoor wet-bulb and outdoor dry-bulb conditions.
- TXV (thermostatic expansion valve) systems: charge by subcooling. Target range is typically 8–14°F per manufacturer specification.
- Both system types: always let the system run at least 15 minutes before finalizing any reading, and defer to the OEM charging chart whenever one is available.
Quick Diagnostic Verdict: On a TXV system, subcooling is your charging metric. On a fixed-orifice system, superheat is. Using the wrong metric for the wrong metering device will lead you to an incorrect charge every time.
Key Takeaways
Accurate superheat and subcooling measurements require the right metering-device match, correct probe placement, full system stabilization, and the OEM charging chart as the final authority.
| Point | Details |
|---|---|
| Match metric to metering device | Use subcooling (8–14°F) for TXV systems; use superheat (10–20°F) for fixed-orifice systems. |
| Stabilize before measuring | Run the system at least 15 minutes before recording any final pressure or temperature reading. |
| Probe placement matters | Clamp thermocouples 6–12 inches from the service port and insulate the probe to block ambient radiation. |
| Read measurements as a pair | Superheat and subcooling together reveal the true cause; either number alone can mislead. |
| Hvac-prime supplies the essentials | Virgin refrigerants, professional diagnostic tools, and SDS/TDS documentation are available at wholesale prices with fast shipping. |
Table of Contents
- What tools do you need to measure superheat and subcooling?
- How to measure subcooling step by step
- How to calculate subcooling: the formula, PT charts, and common pitfalls
- How to measure superheat step by step
- How to calculate superheat: the formula, PT charts, and accuracy checks
- TXV vs. fixed-orifice: which metric drives the charging decision?
- What do high and low superheat and subcooling actually tell you?
- Field tips, common measurement errors, and a troubleshooting checklist
- Worked examples: superheat and subcooling calculations from start to finish
- How to use PT charts and apps accurately in the field
- Research-backed charging guidance and field heuristics
- Hvac-prime has the refrigerants and tools you need on the job
- Sources
What tools do you need to measure superheat and subcooling?
Accurate measurements start with the right instruments. Cutting corners here produces bad data, and bad data leads to wrong charges.
Core instruments:
- Manifold gauge set or digital manifold with a built-in PT-chart function. A digital manifold that auto-converts pressure to saturation temperature eliminates the manual lookup step and reduces transcription errors. Look for one that supports multiple refrigerants, including R-410A, R-32, R-454B, and R-22.
- Clamp-on thermocouple or K-type thermocouple clamp. These are the only reliable way to read pipe surface temperature on copper lines. Infrared guns are not appropriate here — copper’s low emissivity causes IR readings to be significantly off, sometimes by 10°F or more.
- Refrigerant-specific PT chart or app. A printed chart works fine, but a digital app with offline mode is faster and less prone to column-reading errors. More on app features in the PT-chart section below.
- Insulating pipe wrap or foam tape. After clamping your thermocouple, wrap it with foam insulation to block ambient heat radiation from skewing the reading.
- Quality service hoses and port adapters rated for the refrigerant you’re working with. Low-loss fittings reduce refrigerant release during connection.
Optional but useful:
- Refrigerant analyzer to verify refrigerant identity and detect contamination before charging.
- Micron gauge for verifying vacuum depth before charging.
- Filter-drier replacement tools if a restriction is suspected.
Pro Tip: Before any measurement session, zero your manifold gauges and verify thermocouple calibration against a known reference (ice water at 32°F works). A thermocouple that reads 34°F in ice water introduces a 2°F error into every reading you take that day — small enough to ignore on a rough check, large enough to matter on a precise TXV charge.
How to measure subcooling step by step
Run through these steps in order. Skipping stabilization or probe placement shortcuts is the most common source of bad subcooling readings in the field.
Before you start: Confirm the condenser coil is clean, the condenser fan is running at normal speed, and the system has been operating under load for at least 15 minutes. A dirty condenser artificially raises head pressure and produces a falsely high subcooling reading.
- Connect your manifold gauge to the high-side (liquid line) service port. Use the correct adapter for the system’s service port type.
- Read the high-side pressure once the system has stabilized. Record the value in the pressure units your PT chart uses (psig is standard in the US).
- Look up the saturation temperature for that pressure on your PT chart, using the correct refrigerant column. For blends, use the bubble-point (liquid) column. This is your condensing saturation temperature.
- Clamp your thermocouple to the liquid line, 6–12 inches from the condenser outlet or from the liquid line service port. Wrap the probe with foam insulation immediately after clamping.
- Read the liquid line temperature after the probe has had 60–90 seconds to stabilize against the pipe.
- Calculate subcooling: Saturation temperature (from step 3) minus actual liquid line temperature (from step 5). The result is your subcooling value in °F.
- Compare to target. For TXV systems, the typical target is 8–14°F. Always cross-reference the OEM charging chart if one is available.
Pro Tip: If your liquid line temperature reads higher than the saturation temperature — giving you a negative subcooling number — the system either has a severe undercharge, a restriction upstream of your probe, or the probe is not making solid contact with the pipe. Check all three before adding refrigerant.
How to calculate subcooling: the formula, PT charts, and common pitfalls
The subcooling formula is straightforward:
Subcooling = Saturation temperature at high-side pressure − Actual liquid line temperature
Reading a PT chart correctly is where technicians lose accuracy. A few specifics:
- Use the correct refrigerant column. R-410A, R-22, R-32, and R-407C each have their own pressure-temperature relationship. Pulling a saturation temp from the wrong column can introduce a 5–10°F error.
- For zeotropic blends like R-407C, use the bubble-point column for subcooling calculations and the dew-point column for superheat. Mixing them up produces a diagnostic error that can send you in the wrong direction entirely.
- Measure at least 6 inches from condenser fins. Too close to the coil, and residual heat transfer from the fins affects the pipe surface temperature before the refrigerant has fully settled to liquid-line conditions.
- Allow full stabilization before recording. A system that has been running for only 5 minutes has not reached steady-state pressures. Readings taken too early tend to show lower subcooling than the system will actually settle at.
When to use manufacturer charts vs. field-calculated values: If the OEM provides a subcooling charging chart (common on residential split systems), use it. Field-calculated subcooling is your verification tool and your fallback when no chart exists.
Pro Tip: On a hot day with a heavily loaded system, subcooling naturally runs toward the lower end of the target range. On a mild day with low load, it tends to run higher. If your reading is at the edge of the target range, note the ambient conditions before deciding whether to add or recover refrigerant.
How to measure superheat step by step
Superheat measurement follows the same logic as subcooling but on the low side. Probe placement on the suction line is critical — get it wrong and the number is meaningless.
Before you start: Verify the evaporator filter is clean, the blower is running at the correct speed, and the system has been running under normal load for at least 15 minutes. Restricted airflow through the evaporator is one of the most common causes of falsely high superheat readings.
- Connect your manifold gauge to the low-side (suction) service port.
- Read the suction pressure once the system has stabilized. Record in psig.
- Look up the saturation temperature for that suction pressure on your PT chart, using the correct refrigerant column. For blends, use the dew-point (vapor) column. This is your evaporator saturation temperature.
- Clamp your thermocouple to the suction line, approximately 6 inches from the compressor service valve or per OEM guidance. Wrap the probe with foam insulation.
- Read the suction line temperature after the probe stabilizes.
- Calculate superheat: Actual suction line temperature (from step 5) minus saturation temperature (from step 3).
- Compare to target. For fixed-orifice systems, the typical range is 10–20°F. For TXV systems, superheat is not the primary charging metric, but a reading below 5°F signals a risk of liquid slugging and needs immediate attention.
Pro Tip: If superheat readings are fluctuating by more than 3–4°F over a 2-minute window, the system has not stabilized or the TXV is hunting. Wait longer, or check the TXV bulb charge and bulb contact before drawing conclusions.
How to calculate superheat: the formula, PT charts, and accuracy checks
The superheat formula mirrors the subcooling formula in reverse:
Superheat = Actual suction line temperature − Saturation temperature at suction pressure
A few accuracy notes that matter in practice:
PT-chart accuracy checklist:
- Confirm you are using the dew-point column for superheat on blended refrigerants.
- Match pressure units: if your gauge reads psig and your chart uses psia, add 14.7 before looking up.
- Digital manifolds with built-in refrigerant databases automate this conversion and reduce the most common source of calculation error.
- Take at least two readings 60 seconds apart and average them. A single snapshot on a cycling system can be misleading.
Ambient influences to watch for:
- A suction line running through a hot attic picks up heat before reaching your probe. Measure as close to the evaporator outlet as practical.
- Direct sunlight on the suction line near your probe inflates the reading. Shade the measurement point or account for it.
- Cold hands or a wet rag near the clamp will pull the reading down.
A 20°F superheat reading on a fixed-orifice system is generally considered high and often points to an undercharge or a restricted metering device, according to field measurement guidance.
Repeated readings that stay high despite normal airflow and correct probe placement are a reliable signal to check refrigerant charge and metering device condition before doing anything else.
TXV vs. fixed-orifice: which metric drives the charging decision?
The engineering reason for using different metrics on different metering devices comes down to what each device controls.
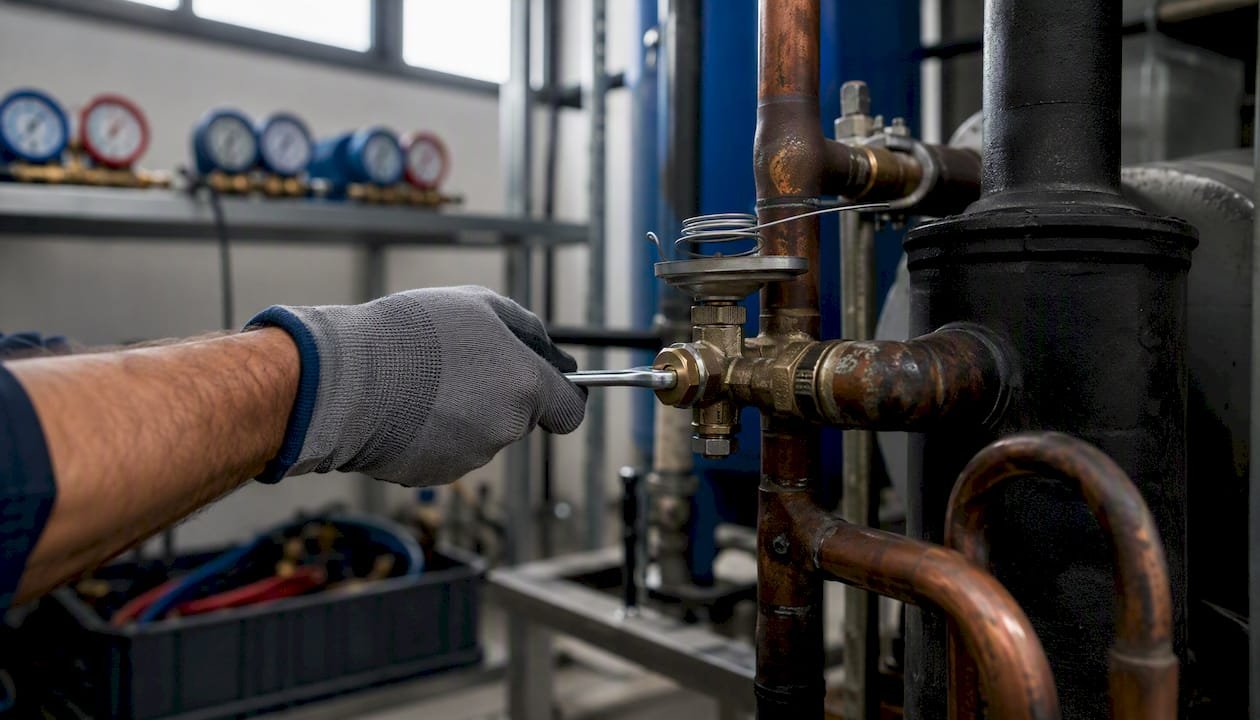
A TXV actively modulates refrigerant flow to maintain a set superheat at the evaporator outlet, typically 8–12°F depending on the valve’s factory setting. Because the valve regulates superheat, the technician cannot use superheat as a reliable indicator of charge level. Add refrigerant to a TXV system and the valve simply closes down to maintain its set point — superheat barely moves while subcooling climbs. That’s why subcooling is the correct charging metric for TXV systems.
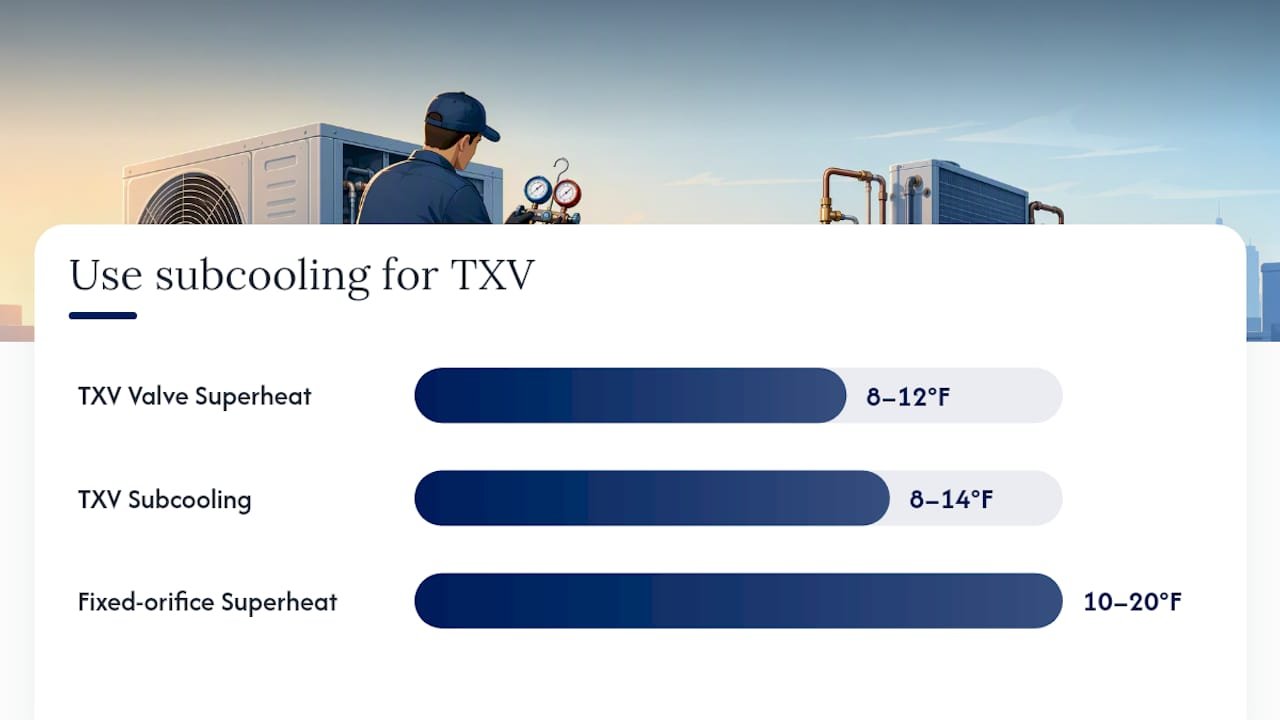
A fixed-orifice (piston) system passes a fixed amount of refrigerant regardless of conditions. Superheat rises when charge is low and drops when charge is high, making it a direct indicator of charge level. The target, though, is not a fixed number — it shifts with load. The field approximation formula for fixed-orifice target superheat is:
(3 × indoor wet-bulb °F − 80 − outdoor dry-bulb °F) ÷ 2
At 63°F indoor wet-bulb and 95°F outdoor dry-bulb, that works out to a 7°F target superheat. Always use the manufacturer’s charging chart when one is provided — the formula is a fallback for when no chart exists.
| System Type | Primary Charging Metric | Typical Target Range | Secondary Check |
|---|---|---|---|
| TXV | Subcooling | 8–14°F | Superheat (verify > 5°F) |
| Fixed-orifice (piston) | Superheat | 10–20°F | Subcooling (verify liquid supply) |
Key rules for both system types:
- Never charge a TXV system by superheat alone, as the valve regulates it automatically and the reading does not reflect actual charge level.
- On fixed-orifice systems, target superheat depends on indoor and outdoor conditions.
- Manufacturer charging charts should be used when available, as they provide the most accurate guidance.
What do high and low superheat and subcooling actually tell you?
Readings only matter if you know what they mean. The diagnostic value of these metrics comes from reading them as a pair, not in isolation. Using both measurements together gives you the full picture: superheat protects the compressor, subcooling confirms liquid supply to the metering device.
| Superheat | Subcooling | Most Likely Cause | Immediate Check |
|---|---|---|---|
| High | Low | Undercharge or refrigerant leak | Check for leaks; verify charge level |
| Low | High | Overcharge | Recover refrigerant carefully; recheck |
| High | High | Restriction in liquid line or metering device | Check filter-drier, TXV, piston orifice |
| Low | Low | Low load, poor airflow, or flooded evaporator | Check airflow, blower speed, return air temp |
| Normal | Normal | System operating correctly | No charge adjustment needed |
Safety-critical readings to act on immediately:
- Superheat below 5°F on any system type means liquid refrigerant may be reaching the compressor. Liquid slugging can destroy a compressor in minutes. Reduce refrigerant flow or recover charge before continuing.
- Very high superheat (above 25°F) combined with low subcooling on a system that was recently serviced points strongly to a leak at a fitting or service port. Pressure-test before adding refrigerant.
Before adding or removing refrigerant, run this checklist:
- Confirm airflow is correct (filter, blower speed, return air temperature).
- Confirm condenser coil is clean and fan is operating.
- Verify probe placement and re-read after full stabilization.
- Check for restrictions (filter-drier pressure drop, kinked lines).
- Only after ruling out airflow and mechanical issues should you adjust charge.
Field tips, common measurement errors, and a troubleshooting checklist
Most bad readings in the field come from the same handful of mistakes. Knowing them in advance saves time and prevents misdiagnosis.
Common measurement errors:
- Poor probe contact. A thermocouple clamp that is not fully seated against the pipe reads ambient air temperature, not pipe temperature. Press it firmly and wrap it.
- Reading too close to fittings or valves. Fittings create turbulence and localized temperature anomalies. Stay at least 6 inches away.
- Using an IR gun on copper lines. Copper’s emissivity is too low for accurate IR readings. Always use a contact thermocouple.
- Not accounting for dew or frost. Frost on a suction line changes the surface temperature the probe reads. Note frost presence and factor it into your interpretation.
- Taking readings before stabilization. Allow at least 15 minutes of runtime before finalizing any measurement.
Troubleshooting checklist by symptom:
- Low cooling capacity: Check superheat first. High superheat on a fixed-orifice system points to undercharge. Also verify airflow — a dirty filter produces the same symptom.
- Noisy compressor: Check superheat immediately. A reading below 5°F means liquid may be entering the compressor. Recover refrigerant if confirmed.
- High head pressure: Check subcooling. High subcooling with high head pressure often indicates overcharge. Also check condenser airflow and coil cleanliness.
- Fluctuating suction pressure: On a TXV system, a hunting valve produces unstable superheat. Check TXV bulb contact and bulb charge before adjusting refrigerant.
- Both readings out of range after a recent service: Suspect a measurement error first. Re-zero gauges, re-seat probes, and re-read after a full stabilization period.
Pro Tip: When a reading looks wrong but you can’t find an obvious cause, validate it with a second method. On superheat, cross-check by measuring the evaporator outlet temperature directly and comparing it to the coil’s saturation temperature from the suction pressure. If the two methods agree, the reading is real. If they disagree, find the measurement error before touching the charge.
When to stop and call for deeper diagnostics: Suspected compressor valve damage, refrigerant contamination (mixed refrigerants), or a system that won’t stabilize after 30 minutes of runtime all warrant a more thorough investigation than superheat and subcooling alone can provide. A refrigerant analyzer is the right next tool when contamination is on the table.
Worked examples: superheat and subcooling calculations from start to finish
These two examples walk through the full calculation sequence so you can replicate the math on any job. Both use R-410A.
Superheat example (fixed-orifice system, R-410A)
- Connect to the suction service port. Suction pressure reads 68 psig.
- Look up 68 psig on the R-410A PT chart (dew-point column). Saturation temperature ≈ 34°F.
- Clamp thermocouple to suction line 6 inches from the service valve. Suction line temperature reads 49°F.
- Superheat = 49°F − 34°F = 15°F.
- Indoor wet-bulb is 63°F, outdoor dry-bulb is 95°F. Using the field formula: (3 × 63 − 80 − 95) ÷ 2 = (189 − 80 − 95) ÷ 2 = 14 ÷ 2 = 7°F target.
- Measured superheat of 15°F is above the 7°F target, suggesting a slight undercharge. Verify airflow before adding refrigerant.
Subcooling example (TXV system, R-410A)
- Connect to the liquid line service port. High-side pressure reads 390 psig.
- Look up 390 psig on the R-410A PT chart (bubble-point column). Saturation temperature ≈ 105°F.
- Clamp thermocouple to liquid line 8 inches from the condenser outlet. Liquid line temperature reads 91°F.
- Subcooling = 105°F − 91°F = 14°F.
- Target subcooling for this TXV system per OEM chart is 10–12°F. At 14°F, the system is slightly overcharged. Recover a small amount of refrigerant and recheck.
| Reading | Superheat Example | Subcooling Example |
|---|---|---|
| System type | Fixed-orifice | TXV |
| Refrigerant | R-410A | R-410A |
| Measured pressure | 68 psig (suction) | 390 psig (liquid) |
| Saturation temp (PT chart) | 34°F | 105°F |
| Line temperature | 49°F | 91°F |
| Calculated ΔT | 15°F superheat | 14°F subcooling |
| OEM/field target | 7°F (field formula) | 10–12°F (OEM chart) |
| Diagnosis | Likely slight undercharge | Slight overcharge |
The complete calculation method — read pressure, convert to saturation temperature, subtract line temperature — applies to any refrigerant. The only variable is which PT-chart column you use.
How to use PT charts and apps accurately in the field
A PT chart is only as useful as the technician reading it. The most common source of PT-chart error is not the chart itself — it’s selecting the wrong column.
Printed chart vs. digital app: A printed chart is reliable and never runs out of battery, but it requires careful column selection and unit verification every time. A digital manifold or app with a built-in refrigerant database automates the pressure-to-temperature conversion and eliminates the column-selection step. For technicians working across multiple refrigerant types in a single day, the digital route is faster and less error-prone.
Critical app features to look for:
- Refrigerant selection with support for current refrigerants (R-410A, R-32, R-454B, R-1234yf, R-407C, R-448A, R-449A).
- Separate dew-point and bubble-point columns for zeotropic blends.
- Pressure unit selection (psig vs. psia vs. bar).
- Offline mode — cell service is not guaranteed in mechanical rooms or rooftops.
- Logging capability to record readings with timestamps.
PT-chart pitfalls to watch for:
- Reading the bubble-point column for superheat on a blend (should be dew-point).
- Using a chart for R-22 on an R-410A system — the pressure ranges don’t overlap, so the error is usually obvious, but not always.
- Forgetting to add atmospheric pressure when converting gauge pressure to absolute for older chart formats.
- Using a chart that does not list your specific refrigerant (common with newer low-GWP blends like R-454B).
PT-chart calculators that list target ranges by refrigerant and application type are a practical field reference, especially when the OEM chart is unavailable.
Pro Tip: Before every job, confirm the refrigerant type with a label check or analyzer reading. A system that was topped off with the wrong refrigerant will show a PT-chart mismatch — the saturation temperature at a given pressure won’t match the expected value for the labeled refrigerant. That mismatch is itself a diagnostic signal.
Research-backed charging guidance and field heuristics
The charging rules covered in this guide are consistent with established field practice across the HVAC industry:
- TXV systems: subcooling is the primary charging metric, with a typical target of 8–14°F. Never use superheat as the primary charging indicator on a TXV system.
- Fixed-orifice systems: superheat is the primary metric, with a typical range of 10–20°F adjusted for load conditions. The field approximation formula provides a load-adjusted target when no OEM chart is available.
- Stabilization: allow at least 15 minutes of runtime before finalizing any measurement. Dynamic readings taken too early produce unreliable data.
- OEM charts supersede field formulas. When a manufacturer provides a charging chart, it accounts for system-specific design factors that generic formulas cannot capture.
- Safety compliance: always follow refrigerant safety data sheets (SDS) and technical data sheets (TDS) for the refrigerant you are handling. Proper PPE and recovery equipment are required by EPA Section 608 regulations for all refrigerants with an ozone-depletion or global-warming potential.
The reading that changed how I approach every diagnostic
Most technicians learn superheat and subcooling as formulas. The shift that actually improves your diagnostics is learning to read them as a pair under real conditions.
On a residential TXV system that had been “charged three times” by two previous technicians, the subcooling was sitting at 18°F and the superheat was a stable 9°F. Both numbers looked plausible in isolation. Together, they pointed to a liquid-line restriction — a partially blocked filter-drier — not an overcharge. The previous technicians had recovered refrigerant each time, which temporarily dropped the subcooling, but the restriction kept driving it back up. Replacing the filter-drier brought subcooling to 11°F without touching the refrigerant charge.
That case reinforced a rule worth adopting: always run the full diagnostic pair before making any charge adjustment. A single number without its counterpart is half a diagnosis.
Hvac-prime has the refrigerants and tools you need on the job
When a diagnostic points to an undercharge, the next problem is sourcing the right refrigerant fast. Hvac-prime stocks a full range of virgin refrigerants — R-410A, R-32, R-454B, R-22, R-134A, R-404A, R-407C, R-448A, R-449A, and R-1234yf — at wholesale prices with fast shipping to contractors and businesses. No waiting on a distributor backorder when a job is on the line.
Beyond refrigerants, Hvac-prime carries the professional HVAC tools that make accurate superheat and subcooling measurements possible: manifold gauge sets, thermocouple clamps, diagnostic kits, and refrigerant analyzers. Every refrigerant order comes with access to SDS and TDS documentation for compliance and safe handling. Browse the full refrigerant and tool catalog at Hvac-prime and place your order today.
Sources
- Measuring superheat and subcooling: practical guide
- Target superheat
- How to Calculate Superheat and Subcooling — The Complete HVAC Guide
- Superheat Calculator – HVAC PT Charts
FAQ
What is the difference between superheat and subcooling?
Superheat measures how many degrees above its boiling point the refrigerant vapor is at the suction line. Subcooling measures how many degrees below its condensing point the liquid refrigerant has dropped at the liquid line. Superheat protects the compressor from liquid slugging; subcooling confirms a full liquid supply to the metering device.
Which metric do I use to charge a TXV system?
Subcooling. A TXV automatically regulates superheat, so superheat readings on a TXV system do not reliably reflect charge level. Target subcooling is typically 8–14°F, but always check the OEM charging chart first.
What is a normal superheat for a fixed-orifice system?
The typical range is 10–20°F, but the correct target depends on indoor wet-bulb and outdoor dry-bulb temperatures. Use the field formula (3 × indoor WB − 80 − outdoor DB) ÷ 2 when no manufacturer chart is available.
Why can’t I use an IR gun to measure line temperatures?
Copper has very low emissivity, which causes infrared thermometers to read significantly lower than the actual pipe surface temperature. Use a contact thermocouple clamp instead.
How long should I let a system run before taking measurements?
At least 15 minutes under normal operating load. Readings taken before the system reaches steady-state conditions are unreliable and can lead to incorrect charge adjustments.
What does high superheat and low subcooling together indicate?
This combination typically points to an undercharge or a refrigerant leak. Check for leaks before adding refrigerant, and verify airflow is not restricted.
What does high subcooling and high superheat together indicate?
A restriction in the liquid line or metering device — often a clogged filter-drier or a faulty TXV. Adding refrigerant will not fix this and may make it worse.




 HVAC
HVAC Automotive
 Refrigerant Diagnostics Kit
 Water Heaters
One thought on “Superheat and Subcooling: The HVAC Technician’s Field Guide”